Robert Bell 09/05/1980

This site is dedicated to experiments in audio-visual moving image and constructions in 3D virtual space. It contains notes on surrounding theories and processes.

Thursday 29 May 2008

Window tones


  • Looking at the building again, I realise that I can read more into the elevation than first meets the eye. Relief mapping can be used to produce accuracy but also to re-interpret!
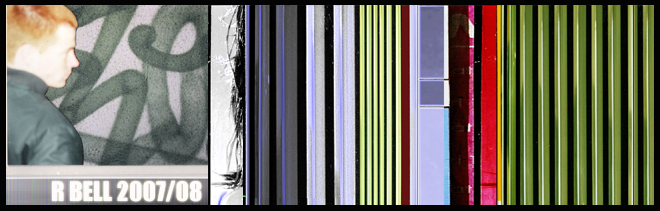
  • The windows on Keybridges facade all contain blinds to block out the outside world, these are all of a muted green or blue shade. each window therefore has its own level of brightness and therefore its own position on a relief model.
1) Each window could be read as a dial tone, as there are ten dial tones for numbers (0-9) we could assign each 'brightness level 10 percentile' a tone. The facade could then be read as a series of numbers each triggering a particular tone.
  • This study shows the brightness levels for each of the main windows on the facade. Note that each floor is made up of three glazed sections however.
  • The lowest section contains only one consistant tone as it is made up one repeated colour, From the ground level it is impossible to see how this works on the very top few floors however.
  • The top window section is usually in shadow caused by the overhanging concrete slab and it is difficult to read as a level. I will take advantage of this fact in some way I'm sure!

I am going to start by concentrating my experiments on the middle section.

Relief Mapping experiments

The 3d modelling I wish to use for this project relies on the process of using relief mapping to read 2d images and turn them into 3D virtual constructs. Cinema 4D does this very efficiently and renders them fairly quickly and accurately.

The first experiment I carried out was to model the front elevation with accuracy using the depth measurements taken on site and from photographs.

Relief mapping works by reading an images levels of brightness and converting them into positions of depth.

White= 100% brightness= furthest forward on the relief map Black= 0% brightness= furthest back on the relief map

Any levels in between get placed accordingly.

The element of the facade nearest you is the metal vertical cladding running up the building (equals white 100%).

The element furthest from you is the glazing (equals black 0%).

The distance between the two is 1500mm, setting the relief map to this then allows me to calculate the levels required for accurately positioning all other elements.

The concrete slab needs a level of brightness = 35%

These levels are applied to the CAD drawing in photoshop in greyscale. Below is the initial relief map for the top eight floors.


Here is the new relief map of 1 floor only and the resulting C4D facade.


Initial 3D Modelling

Although I don't want this to be a normal architectural modelling exercise, I still believe any outcomes should come from an accurate reading of the buildings structure. From the site photographs and drawings/measurements I have drawn the towers front elevation (front being the one facing South Lambeth Rd) in Vectorworks as a 2D line drawing.

This was a useful exercise as it also showed how the being is made from various elements or units that fit into one another to particular ratios. It also highlighted any changes in the buildings elevational rhythm as you progress down the facade.

I have decided to concentrate solely on the front facade and to read it floor by floor from top to bottom.

Attached firstly is a photo of the facade with workings out and notes drawn on. The second image shows the black and white resulting CAD drawing (top eight floors only for now).